Highlights
Einwechslungen
Tabelle
Aufstellungen
Statistiken
Spielerstatistiken
- J. Murphy 2
- J. Shelvey 2
- A. Mitrović 2
- M. Ritchie 2
- M. Ritchie 1
- J. Colback 1
- J. Shelvey 2
- A. Mitrović 2
- M. Diamé 2
- J. Murphy 2
- A. Mitrović 3
- A. Pritchard 2
- D. Yedlin 91
- J. Shelvey 88
- A. Mitrović 10
- M. Dijks 9
- A. Mitrović 11
- D. Yedlin 11
- S. Whittaker 4
- C. Clark 3
- D. Yedlin 2
- W. Hoolahan 2
- D. Yedlin 4
- J. Murphy 3
- A. Mitrović 6
- J. Lascelles 5
- A. Mitrović 7
- Y. Wildschut 5
- S. Whittaker 2
- Ayoze Pérez 2
- K. Darlow 1
- C. Clark 69
- J. Shelvey 67
- C. Clark 54
- J. Shelvey 51
- P. Dummett 4
- M. Ritchie 3
Serie
Vergangene Spiele
-
Andy Madley Hauptschiedsrichter3.50.2Durchschnittliche Anzahl der Karten in 31 Spielen mit diesem Schiedsrichter.
- Andy Haines Vierter Offizieller
- Nigel Lugg Schiedsrichterassistent
- Darren Blunden Schiedsrichterassistent
- Baujahr: 1935
- Oberfläche: Rasen
- Kapazität: 27606
- Zuschauerschnitt: 23541
- Maximale Zuschauerzahl: 27137
- % ausverkauft: 85
Ergebnis des Spiels Norwich Newcastle
- Datum 14 Februar 2017 20:45
- Wettbewerb Championship
- Saison 2016/2017
- Phase Tabelle - Spieltag 32
- Zuschauerzahl 26841
- Code NOR-NEW
- Region England
- Heimteam Norwich City
- Auswärtsteam Newcastle United
Was ist das Ergebnis des Spiels Norwich Newcastle?
Unentschieden zwischen den beiden Mannschaften mit dem Ergebnis 2-2
Wie sind die offiziellen Aufstellungen des Spiels zwischen Norwich und Newcastle?
Norwich City : Trainiert von A. Neil, stellt 4-2-3-1 : J. Ruddy, M. Dijks, T. Klose, R. Martin, S. Whittaker, J. Howson, A. Tettey, Y. Wildschut, W. Hoolahan, J. Murphy, C. Jerome auf
Newcastle United : Das Team seinerseits trainiert von Rafael Benítez, stellt 4-4-1-1 : K. Darlow, P. Dummett, C. Clark, J. Lascelles, D. Yedlin, Y. Gouffran, J. Colback, J. Shelvey, M. Ritchie, Ayoze Pérez, A. Mitrović auf
Wer ist der Schiedsrichter des Spiels zwischen Norwich und Newcastle?
Andy Madley ist der Schiedsrichter dieser Partie
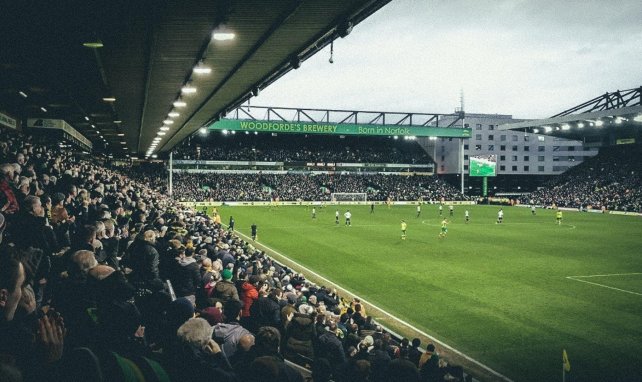
Wo findet das Spiel zwischen Norwich und Newcastle statt?
Das Spiel ist im Stadion Carrow Road in Norwich, Norfolk
Was ist das Datum und die Uhrzeit des Spiels Norwich Newcastle?
Dem Spiel live auf Fussball Heute am 14 Februar 2017 folgen, Anstoß um 20:45
-
-
1
J. Ruddy
-
3
M. Dijks
-
15
T. Klose
-
5
R. Martin
-
2
S. Whittaker
-
8
J. Howson
-
27
A. Tettey
-
17
Y. Wildschut
-
14
W. Hoolahan
-
22
J. Murphy
-
10
C. Jerome
-
1
J. Ruddy
-
-
26
K. Darlow
-
3
P. Dummett
-
2
C. Clark
-
6
J. Lascelles
-
22
D. Yedlin
-
20
Y. Gouffran
-
4
J. Colback
-
12
J. Shelvey
-
11
M. Ritchie
-
17
Ayoze Pérez
-
45
A. Mitrović
-
26
K. Darlow
-
-
 A. Neil Trainer
-
 B. Godfrey
#35
- Verteidiger
B. Godfrey
#35
- Verteidiger
-
 J. Murphy #31 - Mittelfeldspieler86'
 -
 R. Bennett
#24
- Verteidiger
R. Bennett
#24
- Verteidiger
-
 A. Pritchard #21 - Mittelfeldspieler58'
 -
 K. Lafferty #19 - Angreifer80'
 -
 M. McGovern
#33
- Torwart
M. McGovern
#33
- Torwart
-
 S. Bassong
#6
- Verteidiger
S. Bassong
#6
- Verteidiger
-
-
-
Rafael Benítez Trainer
-
 D. Gayle #9 - Angreifer76'
 -
 Jesús Gámez
#27
- Verteidiger
Jesús Gámez
#27
- Verteidiger
-
 M. Diamé #15 - Mittelfeldspieler54'
 -
 C. Atsu #30 - Mittelfeldspieler70'
 -
 G. Hanley
#5
- Verteidiger
G. Hanley
#5
- Verteidiger
-
 R. Elliot
#21
- Torwart
R. Elliot
#21
- Torwart
-
 I. Hayden
#14
- Mittelfeldspieler
I. Hayden
#14
- Mittelfeldspieler
-
- M. Ritchie 1
- J. Colback 1
- J. Shelvey 50% (2/4)
- J. Murphy 50% (2/4)
- Ayoze Pérez 50% (2/4)
- J. Lascelles 50% (1/2)
- J. Shelvey 2
- A. Mitrović 2
- Y. Gouffran 2
- M. Diamé 2
- J. Murphy 2
- D. Gayle 2
- Ayoze Pérez 2
- A. Mitrović 3
- P. Dummett 83% (5/6)
- J. Lascelles 83% (5/6)
- M. Diamé 78% (7/9)
- J. Shelvey 75% (6/8)
- S. Whittaker 4
- C. Clark 3
- J. Lascelles 2
- M. Dijks 2
- J. Lascelles 100% (5/5)
- J. Shelvey 100% (2/2)
- P. Dummett 80% (4/5)
- M. Ritchie 67% (2/3)
- Y. Gouffran 0% (0/7)
- A. Pritchard 0% (0/4)
- Ayoze Pérez 29% (4/14)
- D. Yedlin 35% (6/17)
- J. Murphy 0% (0/2)
- Y. Gouffran 0% (0/2)
- J. Howson 0% (0/2)
- J. Murphy 0% (0/2)
- P. Dummett 4
- M. Ritchie 3
| # | Team | Pkt | G | G | U | VS | T | GT | TV | |
|---|---|---|---|---|---|---|---|---|---|---|
| 1 |
|
94 | 46 | 29 | 7 | 10 | 85 | 40 | 45 | |
| 2 |
|
93 | 46 | 28 | 9 | 9 | 74 | 40 | 34 | |
| 3 |
|
85 | 46 | 26 | 7 | 13 | 68 | 64 | 4 | |
| 4 |
|
81 | 46 | 24 | 9 | 13 | 60 | 45 | 15 | |
| 5 |
|
81 | 46 | 25 | 6 | 15 | 56 | 58 | -2 | |
| 6 |
|
80 | 46 | 22 | 14 | 10 | 85 | 57 | 28 | |
| 7 |
|
75 | 46 | 22 | 9 | 15 | 61 | 47 | 14 | |
| 8 |
|
70 | 46 | 20 | 10 | 16 | 85 | 69 | 16 | |
| 9 |
|
67 | 46 | 18 | 13 | 15 | 54 | 50 | 4 | |
| 10 |
|
64 | 46 | 18 | 10 | 18 | 75 | 65 | 10 | |
| 11 |
|
62 | 46 | 16 | 14 | 16 | 64 | 63 | 1 | |
| 12 |
|
62 | 46 | 17 | 11 | 18 | 60 | 61 | -1 | |
| 13 |
|
62 | 46 | 16 | 14 | 16 | 47 | 48 | -1 | |
| 14 |
|
58 | 46 | 15 | 13 | 18 | 64 | 67 | -3 | |
| 15 |
|
58 | 46 | 16 | 10 | 20 | 54 | 58 | -4 | |
| 16 |
|
55 | 46 | 13 | 16 | 17 | 48 | 58 | -10 | |
| 17 |
|
54 | 46 | 15 | 9 | 22 | 60 | 66 | -6 | |
| 18 |
|
53 | 46 | 15 | 8 | 23 | 52 | 66 | -14 | |
| 19 |
|
53 | 46 | 13 | 14 | 19 | 45 | 64 | -19 | |
| 20 |
|
52 | 46 | 13 | 13 | 20 | 49 | 63 | -14 | |
| 21 |
|
51 | 46 | 14 | 9 | 23 | 62 | 72 | -10 | |
| 22 |
|
51 | 46 | 12 | 15 | 19 | 53 | 65 | -12 | |
| 23 |
|
42 | 46 | 10 | 12 | 24 | 40 | 57 | -17 | |
| 24 |
|
23 | 46 | 5 | 8 | 33 | 40 | 98 | -58 |
- Relegation
| # | Team | Pkt | G | G | U | VS | T | GT | TV |
|---|---|---|---|---|---|---|---|---|---|
| 1 |
|
54 | 23 | 17 | 3 | 3 | 46 | 14 | 32 |
| 2 |
|
53 | 23 | 16 | 5 | 2 | 35 | 16 | 19 |
| 3 |
|
49 | 23 | 15 | 4 | 4 | 55 | 22 | 33 |
| 4 |
|
48 | 23 | 15 | 3 | 5 | 49 | 23 | 26 |
| 5 |
|
47 | 23 | 15 | 2 | 6 | 36 | 22 | 14 |
| 6 |
|
47 | 23 | 15 | 2 | 6 | 34 | 26 | 8 |
| 7 |
|
46 | 23 | 14 | 4 | 5 | 32 | 16 | 16 |
| 8 |
|
44 | 23 | 12 | 8 | 3 | 33 | 20 | 13 |
| 9 |
|
41 | 23 | 11 | 8 | 4 | 33 | 20 | 13 |
| 10 |
|
40 | 23 | 12 | 4 | 7 | 42 | 30 | 12 |
| 11 |
|
39 | 23 | 11 | 6 | 6 | 40 | 26 | 14 |
| 12 |
|
38 | 23 | 11 | 5 | 7 | 42 | 25 | 17 |
| 13 |
|
38 | 23 | 10 | 8 | 5 | 45 | 32 | 13 |
| 14 |
|
37 | 23 | 11 | 4 | 8 | 33 | 26 | 7 |
| 15 |
|
37 | 23 | 11 | 4 | 8 | 31 | 26 | 5 |
| 16 |
|
34 | 23 | 8 | 10 | 5 | 30 | 24 | 6 |
| 17 |
|
32 | 23 | 8 | 8 | 7 | 29 | 30 | -1 |
| 18 |
|
31 | 23 | 9 | 4 | 10 | 30 | 32 | -2 |
| 19 |
|
31 | 23 | 9 | 4 | 10 | 28 | 30 | -2 |
| 20 |
|
29 | 23 | 6 | 11 | 6 | 32 | 33 | -1 |
| 21 |
|
29 | 23 | 8 | 5 | 10 | 25 | 31 | -6 |
| 22 |
|
28 | 23 | 8 | 4 | 11 | 25 | 30 | -5 |
| 23 |
|
23 | 23 | 5 | 8 | 10 | 19 | 26 | -7 |
| 24 |
|
21 | 23 | 5 | 6 | 12 | 23 | 34 | -11 |
| # | Team | Pkt | G | G | U | VS | T | GT | TV |
|---|---|---|---|---|---|---|---|---|---|
| 1 |
|
46 | 23 | 14 | 4 | 5 | 36 | 17 | 19 |
| 2 |
|
42 | 23 | 12 | 6 | 5 | 40 | 25 | 15 |
| 3 |
|
39 | 23 | 11 | 6 | 6 | 28 | 26 | 2 |
| 4 |
|
34 | 23 | 9 | 7 | 7 | 24 | 23 | 1 |
| 5 |
|
34 | 23 | 10 | 4 | 9 | 22 | 32 | -10 |
| 6 |
|
32 | 23 | 10 | 2 | 11 | 33 | 48 | -15 |
| 7 |
|
30 | 23 | 8 | 6 | 9 | 29 | 28 | 1 |
| 8 |
|
29 | 23 | 9 | 2 | 12 | 32 | 34 | -2 |
| 9 |
|
29 | 23 | 8 | 5 | 10 | 29 | 31 | -2 |
| 10 |
|
26 | 23 | 7 | 5 | 11 | 33 | 40 | -7 |
| 11 |
|
26 | 23 | 7 | 5 | 11 | 21 | 30 | -9 |
| 12 |
|
25 | 23 | 6 | 7 | 10 | 29 | 35 | -6 |
| 13 |
|
24 | 23 | 5 | 9 | 9 | 20 | 33 | -13 |
| 14 |
|
23 | 23 | 5 | 8 | 10 | 24 | 37 | -13 |
| 15 |
|
22 | 23 | 6 | 4 | 13 | 22 | 34 | -12 |
| 16 |
|
21 | 23 | 4 | 9 | 10 | 21 | 33 | -12 |
| 17 |
|
21 | 23 | 5 | 6 | 12 | 18 | 34 | -16 |
| 18 |
|
21 | 23 | 5 | 6 | 12 | 30 | 47 | -17 |
| 19 |
|
19 | 23 | 5 | 4 | 14 | 21 | 31 | -10 |
| 20 |
|
19 | 23 | 4 | 7 | 12 | 24 | 35 | -11 |
| 21 |
|
18 | 23 | 4 | 6 | 13 | 14 | 28 | -14 |
| 22 |
|
17 | 23 | 4 | 5 | 14 | 27 | 40 | -13 |
| 23 |
|
11 | 23 | 2 | 5 | 16 | 20 | 42 | -22 |
| 24 |
|
2 | 23 | 0 | 2 | 21 | 17 | 64 | -47 |
| # | Team | Pkt | G | G | U | VS | T | GT | TV |
|---|---|---|---|---|---|---|---|---|---|
| 1 |
|
84 | 46 | 25 | 9 | 10 | 47 | 22 | 25 |
| 2 |
|
84 | 46 | 23 | 15 | 4 | 35 | 16 | 19 |
| 3 |
|
75 | 46 | 19 | 18 | 2 | 37 | 22 | 15 |
| 4 |
|
71 | 46 | 17 | 20 | 5 | 25 | 17 | 8 |
| 5 |
|
64 | 46 | 15 | 19 | 8 | 27 | 23 | 4 |
| 6 |
|
64 | 46 | 13 | 25 | 6 | 22 | 17 | 5 |
| 7 |
|
63 | 46 | 15 | 18 | 10 | 29 | 27 | 2 |
| 8 |
|
62 | 46 | 16 | 14 | 10 | 31 | 31 | 0 |
| 9 |
|
62 | 46 | 16 | 14 | 9 | 30 | 29 | 1 |
| 10 |
|
62 | 46 | 13 | 23 | 5 | 26 | 22 | 4 |
| 11 |
|
60 | 46 | 13 | 21 | 8 | 27 | 23 | 4 |
| 12 |
|
60 | 46 | 12 | 24 | 7 | 21 | 18 | 3 |
| 13 |
|
59 | 46 | 14 | 17 | 9 | 23 | 27 | -4 |
| 14 |
|
59 | 46 | 13 | 20 | 8 | 25 | 32 | -7 |
| 15 |
|
56 | 46 | 11 | 23 | 9 | 20 | 20 | 0 |
| 16 |
|
55 | 46 | 11 | 22 | 5 | 23 | 26 | -3 |
| 17 |
|
52 | 46 | 13 | 13 | 9 | 23 | 26 | -3 |
| 18 |
|
52 | 46 | 12 | 16 | 9 | 20 | 30 | -10 |
| 19 |
|
50 | 46 | 10 | 20 | 8 | 18 | 24 | -6 |
| 20 |
|
49 | 46 | 8 | 25 | 9 | 18 | 26 | -8 |
| 21 |
|
47 | 46 | 8 | 23 | 8 | 17 | 27 | -10 |
| 22 |
|
46 | 46 | 9 | 19 | 11 | 17 | 28 | -11 |
| 23 |
|
44 | 46 | 8 | 20 | 13 | 21 | 37 | -16 |
| 24 |
|
44 | 46 | 6 | 26 | 8 | 19 | 31 | -12 |