Highlights
Einwechslungen
Tabelle
Aufstellungen
Statistiken
Spielerstatistiken
- L. Dunk 1
- T. Hemed 1
- J. Murphy 1
- T. Hemed 1
- S. Doukara 1
- P. Jansson 1
- J. Murphy 3
- H. Sacko 2
- S. Baldock 5
- G. Murray 2
- Bruno Saltor 82
- O. Norwood 77
- S. Duffy 11
- C. Wood 7
- S. Baldock 8
- G. Murray 7
- S. Duffy 4
- Ronaldo Vieira 3
- S. Baldock 3
- Ronaldo Vieira 1
- M. Grimes 4
- Ronaldo Vieira 3
- C. Wood 6
- G. Murray 4
- S. Doukara 4
- L. Dunk 3
- K. Bartley 3
- Ronaldo Vieira 3
- L. Dunk 60
- D. Stephens 59
- D. Stephens 54
- L. Dunk 52
- O. Norwood 3
- Bruno Saltor 1
Serie
Vergangene Spiele
-
Paul Tierney Hauptschiedsrichter4.50.2Durchschnittliche Anzahl der Karten in 10 Spielen mit diesem Schiedsrichter.
- Ian Hussin Schiedsrichterassistent
- Steve Martin Vierter Offizieller
- Andy Garratt Schiedsrichterassistent
- Baujahr: 2011
- Oberfläche: Rasen
- Kapazität: 31876
- Zuschauerschnitt: 24502
- Maximale Zuschauerzahl: 31872
- % ausverkauft: 78
Ergebnis des Spiels Brighton Leeds
- Datum 09 Dezember 2016 20:45
- Wettbewerb Championship
- Saison 2016/2017
- Phase Tabelle - Spieltag 20
- Zuschauerzahl 28206
- Code BHA-LEE
- Region England
- Heimteam Brighton & Hove Albion
- Auswärtsteam Leeds United
Was ist das Ergebnis des Spiels Brighton Leeds?
Brighton & Hove Albion hat gewonnen mit dem Ergebnis 2-0
Wie sind die offiziellen Aufstellungen des Spiels zwischen Brighton und Leeds?
Brighton & Hove Albion : Trainiert von C. Hughton, stellt 4-4-2 : D. Stockdale, S. Pocognoli, L. Dunk, S. Duffy, Bruno Saltor, J. Murphy, O. Norwood, D. Stephens, A. Knockaert, S. Baldock, G. Murray auf
Leeds United : Das Team seinerseits trainiert von G. Monk, stellt 4-2-3-1 : R. Green, C. Taylor, P. Jansson, K. Bartley, L. Ayling, Ronaldo Vieira, K. Phillips, S. Doukara, K. Roofe, H. Sacko, C. Wood auf
Wer ist der Schiedsrichter des Spiels zwischen Brighton und Leeds?
Paul Tierney ist der Schiedsrichter dieser Partie
Wo findet das Spiel zwischen Brighton und Leeds statt?
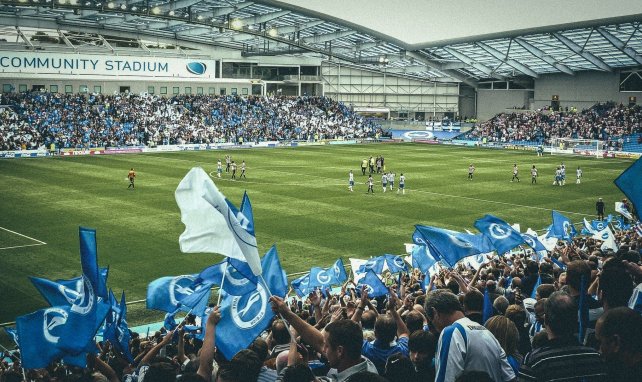
Das Spiel ist im Stadion American Express Stadium in Falmer, East Sussex
Was ist das Datum und die Uhrzeit des Spiels Brighton Leeds?
Dem Spiel live auf Fussball Heute am 09 Dezember 2016 folgen, Anstoß um 20:45
-
-
13
D. Stockdale
-
12
S. Pocognoli
-
5
L. Dunk
-
22
S. Duffy
-
2
Bruno Saltor
-
15
J. Murphy
-
21
O. Norwood
-
6
D. Stephens
-
11
A. Knockaert
-
9
S. Baldock
-
17
G. Murray
-
13
D. Stockdale
-
-
1
R. Green
-
21
C. Taylor
-
18
P. Jansson
-
5
K. Bartley
-
2
L. Ayling
-
25
Ronaldo Vieira
-
23
K. Phillips
-
11
S. Doukara
-
7
K. Roofe
-
24
H. Sacko
-
9
C. Wood
-
1
R. Green
-
-
 C. Hughton Trainer
-
R. Hunt
#42
- Verteidiger
-
 C. Goldson
#18
- Verteidiger
C. Goldson
#18
- Verteidiger
-
 J. Skalák #8 - Mittelfeldspieler87'
 -
 N. Mäenpää
#1
- Torwart
N. Mäenpää
#1
- Torwart
-
 T. Hemed #10 - Angreifer78'
 -
 S. March #20 - Mittelfeldspieler66'
 -
 S. Sidwell
#14
- Mittelfeldspieler
S. Sidwell
#14
- Mittelfeldspieler
-
-
-
G. Monk Trainer
-
 S. Dallas #15 - Verteidiger71'
 -
 G. Berardi
#28
- Verteidiger
G. Berardi
#28
- Verteidiger
-
 M. Grimes #16 - Mittelfeldspieler46'
 -
 L. Cooper #6 - Verteidiger88'
 -
 A. Mowatt
#27
- Mittelfeldspieler
A. Mowatt
#27
- Mittelfeldspieler
-
 M. Silvestri
#12
- Torwart
M. Silvestri
#12
- Torwart
-
 M. Antonsson
#10
- Angreifer
M. Antonsson
#10
- Angreifer
-
- T. Hemed 50% (1/2)
- J. Murphy 50% (1/2)
- J. Murphy 3
- H. Sacko 2
- G. Murray 2
- K. Bartley 2
- A. Knockaert 0% (0/3)
- S. Baldock 5
- P. Jansson 75% (6/8)
- M. Grimes 67% (6/9)
- L. Ayling 63% (12/19)
- C. Taylor 63% (5/8)
- S. Duffy 4
- Ronaldo Vieira 3
- Bruno Saltor 3
- P. Jansson 2
- S. March 100% (2/2)
- S. Duffy 83% (10/12)
- G. Murray 80% (4/5)
- P. Jansson 67% (2/3)
- K. Roofe 0% (0/4)
- T. Hemed 0% (0/4)
- H. Sacko 0% (0/4)
- S. March 0% (0/4)
- S. Baldock 3
- K. Roofe 0% (0/2)
- O. Norwood 0% (0/2)
- D. Stephens 0% (0/2)
- T. Hemed 0% (0/2)
- D. Stephens 92% (54/59)
- Bruno Saltor 88% (51/58)
- O. Norwood 87% (55/63)
- L. Dunk 87% (52/60)
- O. Norwood 3
| # | Team | Pkt | G | G | U | VS | T | GT | TV | |
|---|---|---|---|---|---|---|---|---|---|---|
| 1 |
|
94 | 46 | 29 | 7 | 10 | 85 | 40 | 45 | |
| 2 |
|
93 | 46 | 28 | 9 | 9 | 74 | 40 | 34 | |
| 3 |
|
85 | 46 | 26 | 7 | 13 | 68 | 64 | 4 | |
| 4 |
|
81 | 46 | 24 | 9 | 13 | 60 | 45 | 15 | |
| 5 |
|
81 | 46 | 25 | 6 | 15 | 56 | 58 | -2 | |
| 6 |
|
80 | 46 | 22 | 14 | 10 | 85 | 57 | 28 | |
| 7 |
|
75 | 46 | 22 | 9 | 15 | 61 | 47 | 14 | |
| 8 |
|
70 | 46 | 20 | 10 | 16 | 85 | 69 | 16 | |
| 9 |
|
67 | 46 | 18 | 13 | 15 | 54 | 50 | 4 | |
| 10 |
|
64 | 46 | 18 | 10 | 18 | 75 | 65 | 10 | |
| 11 |
|
62 | 46 | 16 | 14 | 16 | 64 | 63 | 1 | |
| 12 |
|
62 | 46 | 17 | 11 | 18 | 60 | 61 | -1 | |
| 13 |
|
62 | 46 | 16 | 14 | 16 | 47 | 48 | -1 | |
| 14 |
|
58 | 46 | 15 | 13 | 18 | 64 | 67 | -3 | |
| 15 |
|
58 | 46 | 16 | 10 | 20 | 54 | 58 | -4 | |
| 16 |
|
55 | 46 | 13 | 16 | 17 | 48 | 58 | -10 | |
| 17 |
|
54 | 46 | 15 | 9 | 22 | 60 | 66 | -6 | |
| 18 |
|
53 | 46 | 15 | 8 | 23 | 52 | 66 | -14 | |
| 19 |
|
53 | 46 | 13 | 14 | 19 | 45 | 64 | -19 | |
| 20 |
|
52 | 46 | 13 | 13 | 20 | 49 | 63 | -14 | |
| 21 |
|
51 | 46 | 14 | 9 | 23 | 62 | 72 | -10 | |
| 22 |
|
51 | 46 | 12 | 15 | 19 | 53 | 65 | -12 | |
| 23 |
|
42 | 46 | 10 | 12 | 24 | 40 | 57 | -17 | |
| 24 |
|
23 | 46 | 5 | 8 | 33 | 40 | 98 | -58 |
- Relegation
| # | Team | Pkt | G | G | U | VS | T | GT | TV |
|---|---|---|---|---|---|---|---|---|---|
| 1 |
|
54 | 23 | 17 | 3 | 3 | 46 | 14 | 32 |
| 2 |
|
53 | 23 | 16 | 5 | 2 | 35 | 16 | 19 |
| 3 |
|
49 | 23 | 15 | 4 | 4 | 55 | 22 | 33 |
| 4 |
|
48 | 23 | 15 | 3 | 5 | 49 | 23 | 26 |
| 5 |
|
47 | 23 | 15 | 2 | 6 | 36 | 22 | 14 |
| 6 |
|
47 | 23 | 15 | 2 | 6 | 34 | 26 | 8 |
| 7 |
|
46 | 23 | 14 | 4 | 5 | 32 | 16 | 16 |
| 8 |
|
44 | 23 | 12 | 8 | 3 | 33 | 20 | 13 |
| 9 |
|
41 | 23 | 11 | 8 | 4 | 33 | 20 | 13 |
| 10 |
|
40 | 23 | 12 | 4 | 7 | 42 | 30 | 12 |
| 11 |
|
39 | 23 | 11 | 6 | 6 | 40 | 26 | 14 |
| 12 |
|
38 | 23 | 11 | 5 | 7 | 42 | 25 | 17 |
| 13 |
|
38 | 23 | 10 | 8 | 5 | 45 | 32 | 13 |
| 14 |
|
37 | 23 | 11 | 4 | 8 | 33 | 26 | 7 |
| 15 |
|
37 | 23 | 11 | 4 | 8 | 31 | 26 | 5 |
| 16 |
|
34 | 23 | 8 | 10 | 5 | 30 | 24 | 6 |
| 17 |
|
32 | 23 | 8 | 8 | 7 | 29 | 30 | -1 |
| 18 |
|
31 | 23 | 9 | 4 | 10 | 30 | 32 | -2 |
| 19 |
|
31 | 23 | 9 | 4 | 10 | 28 | 30 | -2 |
| 20 |
|
29 | 23 | 6 | 11 | 6 | 32 | 33 | -1 |
| 21 |
|
29 | 23 | 8 | 5 | 10 | 25 | 31 | -6 |
| 22 |
|
28 | 23 | 8 | 4 | 11 | 25 | 30 | -5 |
| 23 |
|
23 | 23 | 5 | 8 | 10 | 19 | 26 | -7 |
| 24 |
|
21 | 23 | 5 | 6 | 12 | 23 | 34 | -11 |
| # | Team | Pkt | G | G | U | VS | T | GT | TV |
|---|---|---|---|---|---|---|---|---|---|
| 1 |
|
46 | 23 | 14 | 4 | 5 | 36 | 17 | 19 |
| 2 |
|
42 | 23 | 12 | 6 | 5 | 40 | 25 | 15 |
| 3 |
|
39 | 23 | 11 | 6 | 6 | 28 | 26 | 2 |
| 4 |
|
34 | 23 | 9 | 7 | 7 | 24 | 23 | 1 |
| 5 |
|
34 | 23 | 10 | 4 | 9 | 22 | 32 | -10 |
| 6 |
|
32 | 23 | 10 | 2 | 11 | 33 | 48 | -15 |
| 7 |
|
30 | 23 | 8 | 6 | 9 | 29 | 28 | 1 |
| 8 |
|
29 | 23 | 9 | 2 | 12 | 32 | 34 | -2 |
| 9 |
|
29 | 23 | 8 | 5 | 10 | 29 | 31 | -2 |
| 10 |
|
26 | 23 | 7 | 5 | 11 | 33 | 40 | -7 |
| 11 |
|
26 | 23 | 7 | 5 | 11 | 21 | 30 | -9 |
| 12 |
|
25 | 23 | 6 | 7 | 10 | 29 | 35 | -6 |
| 13 |
|
24 | 23 | 5 | 9 | 9 | 20 | 33 | -13 |
| 14 |
|
23 | 23 | 5 | 8 | 10 | 24 | 37 | -13 |
| 15 |
|
22 | 23 | 6 | 4 | 13 | 22 | 34 | -12 |
| 16 |
|
21 | 23 | 4 | 9 | 10 | 21 | 33 | -12 |
| 17 |
|
21 | 23 | 5 | 6 | 12 | 18 | 34 | -16 |
| 18 |
|
21 | 23 | 5 | 6 | 12 | 30 | 47 | -17 |
| 19 |
|
19 | 23 | 5 | 4 | 14 | 21 | 31 | -10 |
| 20 |
|
19 | 23 | 4 | 7 | 12 | 24 | 35 | -11 |
| 21 |
|
18 | 23 | 4 | 6 | 13 | 14 | 28 | -14 |
| 22 |
|
17 | 23 | 4 | 5 | 14 | 27 | 40 | -13 |
| 23 |
|
11 | 23 | 2 | 5 | 16 | 20 | 42 | -22 |
| 24 |
|
2 | 23 | 0 | 2 | 21 | 17 | 64 | -47 |
| # | Team | Pkt | G | G | U | VS | T | GT | TV |
|---|---|---|---|---|---|---|---|---|---|
| 1 |
|
84 | 46 | 25 | 9 | 10 | 47 | 22 | 25 |
| 2 |
|
84 | 46 | 23 | 15 | 4 | 35 | 16 | 19 |
| 3 |
|
75 | 46 | 19 | 18 | 2 | 37 | 22 | 15 |
| 4 |
|
71 | 46 | 17 | 20 | 5 | 25 | 17 | 8 |
| 5 |
|
64 | 46 | 15 | 19 | 8 | 27 | 23 | 4 |
| 6 |
|
64 | 46 | 13 | 25 | 6 | 22 | 17 | 5 |
| 7 |
|
63 | 46 | 15 | 18 | 10 | 29 | 27 | 2 |
| 8 |
|
62 | 46 | 16 | 14 | 10 | 31 | 31 | 0 |
| 9 |
|
62 | 46 | 16 | 14 | 9 | 30 | 29 | 1 |
| 10 |
|
62 | 46 | 13 | 23 | 5 | 26 | 22 | 4 |
| 11 |
|
60 | 46 | 13 | 21 | 8 | 27 | 23 | 4 |
| 12 |
|
60 | 46 | 12 | 24 | 7 | 21 | 18 | 3 |
| 13 |
|
59 | 46 | 14 | 17 | 9 | 23 | 27 | -4 |
| 14 |
|
59 | 46 | 13 | 20 | 8 | 25 | 32 | -7 |
| 15 |
|
56 | 46 | 11 | 23 | 9 | 20 | 20 | 0 |
| 16 |
|
55 | 46 | 11 | 22 | 5 | 23 | 26 | -3 |
| 17 |
|
52 | 46 | 13 | 13 | 9 | 23 | 26 | -3 |
| 18 |
|
52 | 46 | 12 | 16 | 9 | 20 | 30 | -10 |
| 19 |
|
50 | 46 | 10 | 20 | 8 | 18 | 24 | -6 |
| 20 |
|
49 | 46 | 8 | 25 | 9 | 18 | 26 | -8 |
| 21 |
|
47 | 46 | 8 | 23 | 8 | 17 | 27 | -10 |
| 22 |
|
46 | 46 | 9 | 19 | 11 | 17 | 28 | -11 |
| 23 |
|
44 | 46 | 8 | 20 | 13 | 21 | 37 | -16 |
| 24 |
|
44 | 46 | 6 | 26 | 8 | 19 | 31 | -12 |