Highlights
Einwechslungen
Tabelle
| # | Team | Pkt | G | G | U | VS | |
|---|---|---|---|---|---|---|---|
| 13 |
|
59 | 46 | 14 | 17 | 15 | |
| 16 |
|
55 | 46 | 13 | 16 | 17 |
Aufstellungen
Statistiken
Spielerstatistiken
- J. Ward 2
- C. Taylor 1
- G. Gardner 2
- T. Adeyemi 1
- T. Diagouraga 2
- Nélson Oliveira 2
- S. Dallas 2
- S. Doukara 2
- Nélson Oliveira 3
- G. Gardner 3
- G. Bellusci 87
- C. Taylor 85
- L. Cooper 10
- L. Cook 8
- J. Ward 8
- L. Bridcutt 8
- L. Bridcutt 4
- G. Bellusci 4
- E. Lichaj 1
- C. Taylor 1
- L. Bridcutt 5
- L. Cooper 4
- G. Gardner 5
- M. Mills 4
- S. Doukara 6
- R. Tesche 2
- L. Bridcutt 3
- L. Cook 2
- D. de Vries 4
- L. Cook 63
- G. Bellusci 62
- G. Bellusci 54
- L. Cooper 52
- M. Antenucci 1
- D. Vaughan 1
Serie
Vergangene Spiele
-
Scott Duncan Hauptschiedsrichter2.10.1Durchschnittliche Anzahl der Karten in 15 Spielen mit diesem Schiedsrichter.
- Lisa Rashid Schiedsrichterassistent
- Darren Handley Vierter Offizieller
- Bob Roberts Schiedsrichterassistent
- Baujahr: 1897
- Oberfläche: Rasen
- Kapazität: 37645
- Zuschauerschnitt: 29547
- Maximale Zuschauerzahl: 37004
- % ausverkauft: 74
Ergebnis des Spiels Leeds Nottingham
- Datum 06 Februar 2016 16:00
- Wettbewerb Championship
- Saison 2015/2016
- Phase Tabelle - Spieltag 30
- Zuschauerzahl 24079
- Code LEE-NFO
- Region England
- Heimteam Leeds United
- Auswärtsteam Nottingham Forest
Was ist das Ergebnis des Spiels Leeds Nottingham?
Nottingham Forest hat gewonnen mit dem Ergebnis 0-1
Wie sind die offiziellen Aufstellungen des Spiels zwischen Leeds und Nottingham?
Leeds United : Trainiert von S. Evans, stellt 4-2-3-1 : M. Silvestri, C. Taylor, L. Cooper, G. Bellusci, S. Wootton, L. Bridcutt, T. Diagouraga, S. Doukara, L. Cook, S. Dallas, M. Antenucci auf
Nottingham Forest : Das Team seinerseits trainiert von D. Freedman, stellt 4-1-4-1 : D. de Vries, B. Jokić, M. Mancienne, M. Mills, E. Lichaj, G. Gardner, B. Osborn, D. Vaughan, R. Tesche, J. Ward, Nélson Oliveira auf
Wer ist der Schiedsrichter des Spiels zwischen Leeds und Nottingham?
Scott Duncan ist der Schiedsrichter dieser Partie
Wo findet das Spiel zwischen Leeds und Nottingham statt?
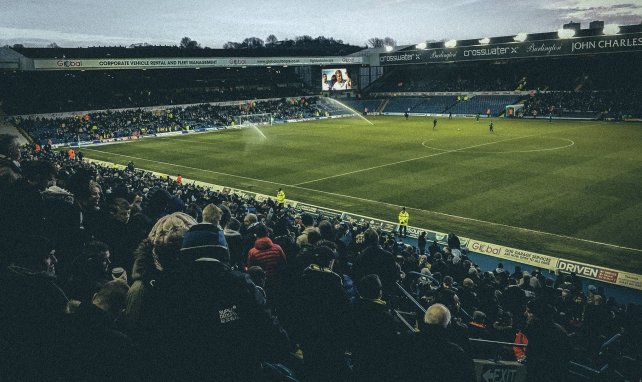
Das Spiel ist im Stadion Elland Road in Leeds, West Yorkshire
Was ist das Datum und die Uhrzeit des Spiels Leeds Nottingham?
Dem Spiel live auf Fussball Heute am 06 Februar 2016 folgen, Anstoß um 16:00
-
-
1
M. Silvestri
-
21
C. Taylor
-
6
L. Cooper
-
5
G. Bellusci
-
4
S. Wootton
-
26
L. Bridcutt
-
16
T. Diagouraga
-
11
S. Doukara
-
23
L. Cook
-
15
S. Dallas
-
7
M. Antenucci
-
1
M. Silvestri
-
-
1
D. de Vries
-
3
B. Jokić
-
4
M. Mancienne
-
5
M. Mills
-
2
E. Lichaj
-
22
G. Gardner
-
38
B. Osborn
-
24
D. Vaughan
-
32
R. Tesche
-
19
J. Ward
-
17
Nélson Oliveira
-
1
D. de Vries
-
-
 S. Evans Trainer
-
 S. Bamba
#3
- Verteidiger
S. Bamba
#3
- Verteidiger
-
 T. Adeyemi #24 - Mittelfeldspieler90'
 -
 L. Erwin #19 - Angreifer81'
 -
 M. Carayol #18 - Mittelfeldspieler70'
 -
 L. Murphy
#8
- Mittelfeldspieler
L. Murphy
#8
- Mittelfeldspieler
-
L. Coyle
#31
- Verteidiger
-
 B. Peacock-Farrell
#45
- Torwart
B. Peacock-Farrell
#45
- Torwart
-
-
-
D. Freedman Trainer
-
 Ryan Mendes
#15
- Angreifer
Ryan Mendes
#15
- Angreifer
-
J. Grant
#37
- Mittelfeldspieler
-
 O. Burke #35 - Angreifer75'
 -
C. Cohen
#8
- Mittelfeldspieler
-
D. Evtimov
#26
- Torwart
-
D. Blackstock #23 - Angreifer89'
-
 J. Hobbs
#25
- Verteidiger
J. Hobbs
#25
- Verteidiger
-
- Nélson Oliveira 60% (3/5)
- R. Tesche 50% (1/2)
- B. Osborn 50% (1/2)
- S. Dallas 50% (1/2)
- T. Diagouraga 2
- Nélson Oliveira 2
- S. Dallas 2
- S. Doukara 2
- L. Cook 2
- S. Doukara 0% (0/3)
- Nélson Oliveira 3
- G. Gardner 3
- L. Cooper 77% (10/13)
- M. Mills 71% (5/7)
- L. Cook 67% (8/12)
- G. Gardner 63% (10/16)
- L. Bridcutt 4
- G. Bellusci 4
- D. Vaughan 3
- E. Lichaj 3
- L. Cooper 75% (6/8)
- M. Mancienne 75% (3/4)
- G. Gardner 71% (5/7)
- O. Burke 67% (2/3)
- M. Antenucci 0% (0/8)
- R. Tesche 0% (0/4)
- S. Dallas 0% (0/4)
- E. Lichaj 0% (0/4)
- L. Bridcutt 0% (0/2)
- E. Lichaj 0% (0/2)
- C. Taylor 90% (45/50)
- L. Bridcutt 90% (78/87)
- G. Bellusci 87% (54/62)
- S. Doukara 86% (44/51)
- L. Cook 21
| # | Team | Pkt | G | G | U | VS | T | GT | TV | |
|---|---|---|---|---|---|---|---|---|---|---|
| 1 |
|
93 | 46 | 26 | 15 | 5 | 72 | 35 | 37 | |
| 2 |
|
89 | 46 | 26 | 11 | 9 | 63 | 31 | 32 | |
| 3 |
|
89 | 46 | 24 | 17 | 5 | 72 | 42 | 30 | |
| 4 |
|
83 | 46 | 24 | 11 | 11 | 69 | 35 | 34 | |
| 5 |
|
78 | 46 | 21 | 15 | 10 | 66 | 43 | 23 | |
| 6 |
|
74 | 46 | 19 | 17 | 10 | 66 | 45 | 21 | |
| 7 |
|
69 | 46 | 18 | 15 | 13 | 53 | 51 | 2 | |
| 8 |
|
68 | 46 | 17 | 17 | 12 | 56 | 51 | 5 | |
| 9 |
|
65 | 46 | 19 | 8 | 19 | 72 | 67 | 5 | |
| 10 |
|
63 | 46 | 16 | 15 | 15 | 53 | 49 | 4 | |
| 11 |
|
62 | 46 | 15 | 17 | 14 | 45 | 45 | 0 | |
| 12 |
|
60 | 46 | 14 | 18 | 14 | 54 | 54 | 0 | |
| 13 |
|
59 | 46 | 14 | 17 | 15 | 50 | 58 | -8 | |
| 14 |
|
58 | 46 | 14 | 16 | 16 | 53 | 58 | -5 | |
| 15 |
|
55 | 46 | 13 | 16 | 17 | 46 | 46 | 0 | |
| 16 |
|
55 | 46 | 13 | 16 | 17 | 43 | 47 | -4 | |
| 17 |
|
52 | 46 | 13 | 13 | 20 | 52 | 59 | -7 | |
| 18 |
|
52 | 46 | 13 | 13 | 20 | 54 | 71 | -17 | |
| 19 |
|
51 | 46 | 13 | 12 | 21 | 59 | 70 | -11 | |
| 20 |
|
51 | 46 | 12 | 15 | 19 | 66 | 79 | -13 | |
| 21 |
|
49 | 46 | 13 | 10 | 23 | 53 | 71 | -18 | |
| 22 |
|
40 | 46 | 9 | 13 | 24 | 40 | 80 | -40 | |
| 23 |
|
39 | 46 | 9 | 12 | 25 | 39 | 69 | -30 | |
| 24 |
|
30 | 46 | 5 | 15 | 26 | 41 | 81 | -40 |
- Relegation
| # | Team | Pkt | G | G | U | VS | T | GT | TV |
|---|---|---|---|---|---|---|---|---|---|
| 1 |
|
53 | 23 | 16 | 5 | 2 | 34 | 8 | 26 |
| 2 |
|
52 | 23 | 15 | 7 | 1 | 47 | 12 | 35 |
| 3 |
|
51 | 23 | 15 | 6 | 2 | 38 | 14 | 24 |
| 4 |
|
50 | 23 | 15 | 5 | 3 | 40 | 18 | 22 |
| 5 |
|
47 | 23 | 13 | 8 | 2 | 42 | 17 | 25 |
| 6 |
|
45 | 23 | 12 | 9 | 2 | 33 | 20 | 13 |
| 7 |
|
43 | 23 | 12 | 7 | 4 | 37 | 16 | 21 |
| 8 |
|
39 | 23 | 10 | 9 | 4 | 37 | 25 | 12 |
| 9 |
|
35 | 23 | 9 | 8 | 6 | 28 | 24 | 4 |
| 10 |
|
34 | 23 | 10 | 4 | 9 | 33 | 30 | 3 |
| 11 |
|
33 | 23 | 8 | 9 | 6 | 25 | 20 | 5 |
| 12 |
|
32 | 23 | 8 | 8 | 7 | 29 | 23 | 6 |
| 13 |
|
32 | 23 | 9 | 5 | 9 | 27 | 27 | 0 |
| 14 |
|
31 | 23 | 7 | 10 | 6 | 26 | 26 | 0 |
| 15 |
|
31 | 23 | 7 | 10 | 6 | 21 | 21 | 0 |
| 16 |
|
30 | 23 | 8 | 6 | 9 | 31 | 34 | -3 |
| 17 |
|
29 | 23 | 8 | 5 | 10 | 36 | 36 | 0 |
| 18 |
|
29 | 23 | 7 | 8 | 8 | 25 | 26 | -1 |
| 19 |
|
29 | 23 | 7 | 8 | 8 | 23 | 28 | -5 |
| 20 |
|
28 | 23 | 7 | 7 | 9 | 34 | 34 | 0 |
| 21 |
|
27 | 23 | 7 | 6 | 10 | 33 | 33 | 0 |
| 22 |
|
26 | 23 | 5 | 11 | 7 | 24 | 26 | -2 |
| 23 |
|
24 | 23 | 7 | 3 | 13 | 21 | 37 | -16 |
| 24 |
|
23 | 23 | 5 | 8 | 10 | 23 | 35 | -12 |
| # | Team | Pkt | G | G | U | VS | T | GT | TV |
|---|---|---|---|---|---|---|---|---|---|
| 1 |
|
42 | 23 | 11 | 9 | 3 | 34 | 21 | 13 |
| 2 |
|
39 | 23 | 9 | 12 | 2 | 32 | 24 | 8 |
| 3 |
|
36 | 23 | 10 | 6 | 7 | 29 | 23 | 6 |
| 4 |
|
35 | 23 | 9 | 8 | 6 | 29 | 27 | 2 |
| 5 |
|
34 | 23 | 9 | 7 | 7 | 25 | 27 | -2 |
| 6 |
|
31 | 23 | 7 | 10 | 6 | 26 | 22 | 4 |
| 7 |
|
31 | 23 | 9 | 4 | 10 | 39 | 37 | 2 |
| 8 |
|
31 | 23 | 8 | 7 | 8 | 24 | 24 | 0 |
| 9 |
|
31 | 23 | 9 | 4 | 10 | 22 | 23 | -1 |
| 10 |
|
30 | 23 | 7 | 9 | 7 | 27 | 30 | -3 |
| 11 |
|
27 | 23 | 6 | 9 | 8 | 24 | 28 | -4 |
| 12 |
|
27 | 23 | 7 | 6 | 10 | 27 | 32 | -5 |
| 13 |
|
26 | 23 | 6 | 8 | 9 | 18 | 21 | -3 |
| 14 |
|
24 | 23 | 6 | 6 | 11 | 26 | 37 | -11 |
| 15 |
|
24 | 23 | 6 | 6 | 11 | 20 | 37 | -17 |
| 16 |
|
23 | 23 | 5 | 8 | 10 | 17 | 23 | -6 |
| 17 |
|
23 | 23 | 5 | 8 | 10 | 23 | 31 | -8 |
| 18 |
|
22 | 23 | 4 | 10 | 9 | 30 | 43 | -13 |
| 19 |
|
21 | 23 | 4 | 9 | 10 | 17 | 29 | -12 |
| 20 |
|
19 | 23 | 5 | 4 | 14 | 27 | 39 | -12 |
| 21 |
|
19 | 23 | 5 | 4 | 14 | 22 | 37 | -15 |
| 22 |
|
17 | 23 | 4 | 5 | 14 | 17 | 45 | -28 |
| 23 |
|
15 | 23 | 2 | 9 | 12 | 18 | 32 | -14 |
| 24 |
|
4 | 23 | 0 | 4 | 19 | 17 | 55 | -38 |
| # | Team | Pkt | G | G | U | VS | T | GT | TV |
|---|---|---|---|---|---|---|---|---|---|
| 1 |
|
75 | 46 | 17 | 24 | 3 | 31 | 13 | 18 |
| 2 |
|
74 | 46 | 18 | 20 | 3 | 37 | 24 | 13 |
| 3 |
|
73 | 46 | 16 | 25 | 4 | 26 | 9 | 17 |
| 4 |
|
69 | 46 | 17 | 18 | 8 | 31 | 19 | 12 |
| 5 |
|
67 | 46 | 14 | 25 | 4 | 27 | 16 | 11 |
| 6 |
|
64 | 46 | 16 | 16 | 7 | 27 | 29 | -2 |
| 7 |
|
63 | 46 | 14 | 21 | 5 | 27 | 24 | 3 |
| 8 |
|
62 | 46 | 15 | 17 | 8 | 29 | 31 | -2 |
| 9 |
|
62 | 46 | 14 | 20 | 7 | 28 | 22 | 6 |
| 10 |
|
61 | 46 | 12 | 25 | 3 | 23 | 18 | 5 |
| 11 |
|
61 | 46 | 10 | 31 | 3 | 18 | 16 | 2 |
| 12 |
|
60 | 46 | 11 | 27 | 5 | 27 | 17 | 10 |
| 13 |
|
59 | 46 | 12 | 23 | 8 | 21 | 22 | -1 |
| 14 |
|
58 | 46 | 14 | 16 | 9 | 35 | 36 | -1 |
| 15 |
|
56 | 46 | 12 | 20 | 10 | 24 | 27 | -3 |
| 16 |
|
55 | 46 | 12 | 19 | 7 | 22 | 23 | -1 |
| 17 |
|
53 | 46 | 10 | 23 | 7 | 21 | 25 | -4 |
| 18 |
|
51 | 46 | 10 | 21 | 8 | 16 | 21 | -5 |
| 19 |
|
51 | 46 | 9 | 24 | 6 | 17 | 24 | -7 |
| 20 |
|
50 | 46 | 11 | 17 | 10 | 24 | 36 | -12 |
| 21 |
|
50 | 46 | 10 | 20 | 8 | 21 | 33 | -12 |
| 22 |
|
49 | 46 | 10 | 19 | 9 | 19 | 28 | -9 |
| 23 |
|
39 | 46 | 5 | 24 | 12 | 17 | 35 | -18 |
| 24 |
|
35 | 46 | 4 | 23 | 8 | 15 | 35 | -20 |